


Schoonmaker Creek: A guide for the perplexed
The city thinks it could cost up to $100 million dollars to reduce flooding from Schoonmaker creek

[I]t could be 35, 50, 75, 100 million dollars worth of capital. This is the largest capital project that the city has ever undertaken in their history. It’s going to take years to get through the design and analysis, and it could take decades to build depending on how aggressive we want to be in addressing our issues. This is a major, major deal.
-Bill Wehrley, City Engineer
We shouldn’t wait for cavalry. There is none […] I sometimes have moments of panic around this project.
-John Ruggini, Finance Director
In part (I), I explain what and where Schoonmaker is. In part (II) and (III), I try to explain why you might care, and in part (IV) and (V) I discuss what information elected officials might consider as they decide how to proceed on the largest capital improvement project in the city’s history.
I. What is Schoonmaker Creek?
Allow me to explain (and excuse my MS Paint Job).

The inset picture above on the bottom left is an outline of Wauwatosa. The purple circle roughly denotes the zoomed-in area captured by the larger picture. The area inside the yellow line is the Schoonmaker Creek watershed. If rain falls inside the yellow lines, it eventually ends up in Schoonmaker Creek. Schoonmaker Creek is mostly underground (it used to be above ground like you would expect a creek to be, but in the 1930s they installed sewer piping to redirect the flow of water underground to reduce flooding in the area).
The creek supposedly begins in Kops Park located just outside of the larger picture in the direction noted by the green arrow in the upper left corner. In the inset picture, Kops Park is in the green circle. Intuitively, I would expect the source of the creek to be within the watershed and not outside of it, but I am not a hydrologist so my intuition probably doesn’t count for much, and it’s really not that important. I’m just trying to orient you.
Wherever Schoonmaker Creek begins, it flows mostly south and east staying underground until it emerges into an open channel around the Washington Highlands neighborhood (the lighter blue line). It continues to flow southeast until it drains into the Menomenee River (the darker blue line).
II. Interesting. Why should I care?
When it rains heavily, the small sewer pipes and open channel aren’t large enough to transport all the water along its length and into the Menomenee River. The water begins to back up, flooding streets and basements.

For example, over a 24-hour period in July, 2010, part of Wauwatosa received 5.5" of rain fall with 4.2” of that occurring over a 3-hour period. Based on historical records, one should expect rain fall this heavy every 50 to 100 years. This produced, on various streets, between 1.3 and 2.4 feet of standing water. The experts call this "ponding."

Over another 24-hour period in June, 2018, 3.8" of rain fell, with an estimated 2.7" over the most intense 3-hour period. Based on past measurement, one should expect rain fall this heavy every 10 years. This produced ponding of 1-2 feet of water along North 70th St. and Meinecke Ave. that took approximately an hour to drain.

III. I don’t live in this part of Wauwatosa. I’m still not sure I care.
Completing a $100 million dollar capital improvement project could take up to a decade to complete and would involve either forgoing lots of other infrastructure investment around the city or increasing your utility bills and property taxes to cover the additional cost.
During an April 26th Financial Affairs meeting, representatives from the city’s Public Works and Engineering Departments gave a short overview of potential ways to reduce or eliminate this flooding. Referring to a 2020 report by the South Eastern Wisconsin Regional Planning Commission (SEWRPC, pronounced—appropriately—“sewer-pack”), they broadly described sixteen potential projects that ranged in cost from a little over $3 million dollars to almost $70 million dollars. And these figures don’t even include ongoing operation costs or other ancillary costs that will almost certainly be necessary.
For instance, many of these projects involve removing the old storm water sewer underneath the road and putting in a larger one. But there are other utilities underneath the road that will need to be moved as well to accommodate the larger storm sewer. Those costs aren’t included.
Another example. Hundreds of homes and buildings have experienced basement flooding once the water in the streets gets high enough to push into people’s homes. Some of these solutions would prevent that. But people also have sewage that backs up into their basements from overflowing sewage pipes. None of these solutions address this problem and fixing it will cost more money.
A figure that kept getting thrown around during the meeting was $100 million dollars. None of the projects listed cost that much, and I’m not sure exactly where the amount came from, but it may be accounting for some of these other costs.
As a point of comparison, the largest single capital improvement project the city has ever undertaken is $12 million dollars. The annual capital improvement budget, which includes things like fixing potholes, repairing bridges, building new pumping stations, and installing large storm sewer pipes, is about $25-30 million dollars. The entire yearly budget for the city of Wauwatosa is $70 million dollars.
IV. Okay, I care now. I hope our elected officials give this a lot of thought and make the right choice.
SEWRPC came up with sixteen potential solutions that involved putting in increasingly large storm-sewer pipes, building additional retention tanks, and expanding the size of the open channel that passes through the Washington Highlands. Eventually, I think, the Common Council is expected to choose one of these to fund.
To help with this decision, each of these plans was evaluated in terms of its cost, how effective it would be at reducing flooding, whether the plan would require the acquisition of private property (e.g., adjacent houses that would be in the way of a new, larger channel), how disruptive construction would be, and whether other pipes and utilities would get in the way. It was all summarized in one somewhat-difficult-to-parse table:

While this table was referenced frequently during the Financial Affairs Committee’s discussion of Schoonmaker Creek, I think it is a relatively poor one from which to expect a bunch of alders to decide what to spend money on.
The Department of Public Works (who, just to be clear, isn’t responsible for this chart and wasn’t asking the Financial Affairs committee to make a decision based upon it) and some of the alders seemed to think that the main problem is that there were too many options. At one point the City Engineer says:
So our thought is that we would, as staff, we’d go through this list, and we’d come back—maybe in July or so—with a short list and present to this group and say, This is what we think we should take off the table and this is where we want to refine our efforts.
But I actually think they list too few options and the ones that are included are summarized in a way that obscures or ignores important information relevant to making a decision. And while they could perhaps just read the 200-page report, many probably won’t, and being able to summarize things in a way that clearly articulates the relevant tradeoffs between alternatives is important.
V. It sounds like you have some suggestions?
Nobody asked me, but if I was trying to decide what to spend money on, I would want to see a wider set of proposed solutions evaluated against criteria that better capture the concerns and values of all stakeholders. I would also want to understand how these different solutions might perform across a range of potential futures in order to account for the uncertainties inherent in planning a 10 or 20 or 30-year infrastructure project that itself is supposed to last, hopefully, another 100 years.
Basically, I think decision makers should ask for something along the lines of what the RAND Corporation did for municipalities around Pittsburgh as they attempted to cope with increased stormwater runoff from their watershed.
It is not an easy read, but I’ll briefly describe some of the ideas from the report that I thought were useful:
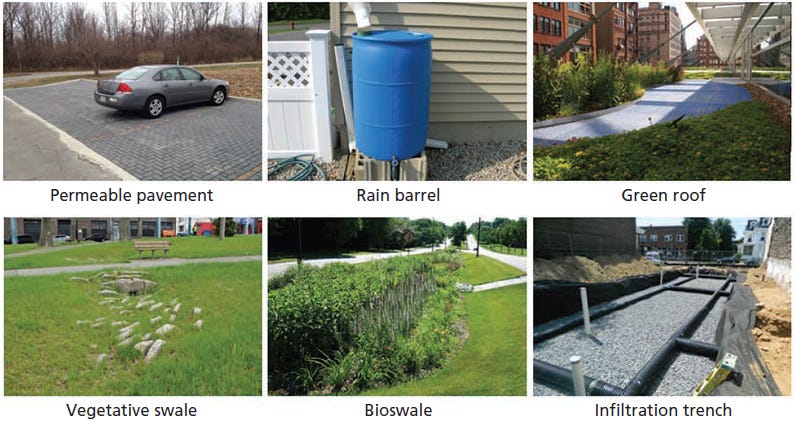
→ A wide range of alternatives: All of the options in the SEWRPC report are what are called “gray infrastructure” projects. Gray infrastructure includes things like bigger pipes, wider ditches, and big tanks made out of concrete. But there’s also green infrastructure—things like rain barrels, bioswales, and permeable pavement that can not only help mitigate stormwater overflow, but also offer ancillary benefits like being pleasant to look at or walk through.
To its credit, the 200+ page SEWRPC report does mention green infrastructure alternatives, but as far as I can tell, only considers rain barrels next to homes and finds that they have a very small effect on Schoonmaker Creek flood flows. But it seems like there are a wider range of alternatives in this category that might be worth considering.
Additionally, it would be useful to present alternatives not as mutually exclusive and monolithic but as comprised of a set of smaller building blocks—individual improvements that can be combined or separated depending on how much money you have to spend and how much mitigation is required. For example, we could extend the 100-year sewer (alternative 6) and put in new sewer piping in East Milwaukee (alternative 7) and add bioswale to parks within the watershed area, and it would be useful to see how effective doing all of those things together might be compared to doing just one or two of them or compared to doing an entirely different set of things.
I think this is already done to some extent, but it’s certainly not clear from the table above. For instance, in the SEWRPC report it mentions that Alternative 5 “also includes bridge improvements at three locations along the open channel portion of Schoonmaker Creek (Map 3.6), as well as the open channel improvements as described for Alternative 4,” but I think it’s something that could be presented more clearly in these types of summary tables that will likely receive a lot of scrutiny from the people who ultimately have to make a decision.
→ Clear metrics: I think the table above does get at some of the things stakeholders care about. Commuters care that the roads are going to be ripped up, homeowners care if the city is just going to buy and raze their house. But I think people would be surprised that, for instance, the SEWRPC report identifies 280 structures “impacted” by flooding but all the options only talk about preventing flooding damage in 46 of them. (This might hinge on a difference between “impacted” and “flooded,” but the report itself never really makes this clear.)
It was also interesting to me that there’s no real attempt, in this chart, to present the costs and benefits in a way that allows for straightforward comparison. We care about people’s basements flooding because it causes damage that someone must pay money to fix. What’s the cost to do nothing? The report itself provides this information on page 19 where it adds up the monetary costs of flood losses and weights them by their likelihood of occurring (i.e., while a 100-year storm will cause more damage it’s also less likely to occur than a 10-year storm.). It comes up with an annualized cost of $3.1 million dollars. Is it worth spending $100 million dollars to prevent $3 million dollars of damage each year? It’s not obvious the answer is ‘no,’ but it’s not clear that the answer is ‘yes’ either. This seems like an important piece of information to consider when making a decision.
It was also mentioned during the meeting that if street flooding is severe enough, it impedes the ability of the police and fire department to respond to emergencies. This seems bad but how bad is it actually, and how bad does it need to be to make spending $100 million dollars preventing it worthwhile? Perhaps they could just take a different route.
While less applicable for bigger pipes and concrete retention tanks, green infrastructure can also provide ancillary benefits like green space and other amenities and the dollar value of these types of benefits is worth trying to estimate and include so that costs and benefits can be easily compared across different sets of options.
Further, the costs listed in the table above are incomplete. They include the costs of installing a larger sewer pipe but not the cost of moving other nearby pipes to accommodate it. They don’t include ongoing maintenance and operation costs.
Finally, none of these projects solve the problem of sewage backing up into people’s basements. During the Financial Affairs meeting, the presenters did mention that the choices we make about stormwater today will affect what choices we ultimately make about sewage in the future, but it would be nice to have some estimate of future choices the city is committing itself to with its current choices and what costs that might entail.
In addition to more complete cost-benefit accounting, it would be useful for decision makers to be able to easily compare across each of the proposed alternatives things like:
How many houses will get flooded,
What the combined estimated sewer overflows each year are,
How frequently street flooding and basement flooding occurs, and
How intense this flooding is expected to be.
Some—but not all—of these things are available in the longer report, but it would beneficial to have it summarized in one or two tables for easy comparison
→ Accounting for uncertainty: I’ll start with this exchange between Ald. Welch and the City Engineer:
[Ald. Welch] I'm looking up at your list here, and it seems that so much of what you're still doing is still trying to direct or divert water into pipes underground. And I mean, everything that I've been learning about is [that there will be] higher rates of rain frequency.. Is it even realistic to continue to deal with the concept of Well, we'll just make the pipes underground bigger and bigger. And yet the rain events are going to get more and more intense, and at what point do we consider that we need really a broader approach with different systems combined and how far you've gotten with that. Because that's certainly going to affect the cost. And I think also it affects what realistic expectations residents can have, because if rain events keep increasing in intensity, there's a limit to what we realistically can do. Can you address that a little bit?"
[City Engineer] That's an excellent question. Let's back up 25 years when MMSD started building the deep tunnel system. The deep tunnel was sold—at the time—that it was going to end sewer overflows. So they designed it for a specific intensity of rain storm that has been exceeded many times since the deep tunnel went into operation. And therefore some deem it a failure and others [say] it was oversold.
So, when we decide how we're going to address this issue, we're going to decide as to what level of service we're going to design for. And if we design it for a 6" rain and we get 7" of rain, we're saying right up front—this isn't going to fix the flooding. This is going to reduce the frequency and severity of flooding. Those are the escape words we're going to use. Because we'll say, It's designed for a 6" rain, and by god it's going to work for a 6" rain. But if we get an 8" rain and the road floods, we're gonna say, Well yeah, we got more rain than we designed for. It's a delicate dance between overbuilding or finding out what's palatable. Or what's a nuisance versus what's a problem.
The City Engineer sort-of answers her question, but he frames it entirely as a problem of communication rather than as partly a problem of communication and mostly a problem of planning.
During the meeting, one of the presenters says that they want to size the sewer to handle an amount of rainfall that is expected to occur once every 100 years. But what Ald. Welch is pointing out is that severe rainstorms that used to occur every 100 years might now occur every 50, or 25, or 10 years and might occur even more frequently in the future. Yet, there’s no mention of climate change in the SEWRPC report. Nor does there really seem to be an acknowledgment that the future may, for whatever reason, look different than the past.
We already know that rainfall in the Midwest has already increased 5-10% from historical baselines. And this is only talking about average rainfall. The rainfall seen during the wettest days of the year has actually increased by about 35%. It may increase more. And it seems reasonable to expect that those considering a potentially huge capital improvement project be able to hear from the engineers something like, If we build the pipe this large, in a future with as much rain as we have today, we would expect this much flooding, this many times per year, in these places. And in a future with more rain than today, we would expect some greater amount of flooding, this many times per year, covering some larger area.
And I think this framing is more useful to residents and to the council members that have to approve funding than “[I]t's designed for a 6" rain, and by god it's going to work for a 6" rain. But if we get an 8" rain and the road floods, we're gonna say, Well yeah, we got more rain than we designed for.”
The implications of not considering this are potentially very large. For example, the SEWRPC report discusses historic rainfall data from the National Oceanic and Atmospheric Administration (NOAA) that it uses to model surface flooding. In RAND’s study of the Pittsburgh watershed, they actually looked at the same data and compared it to 16 years of more recent locally-generated data. Based on the NOAA data, they:
expected approximately 8 24-hour events where at least 2.3 inches of rain fell, but over this period we observe 18 events meeting or exceeding this threshold. For the 5-year event, we would expect just over three 24-hour storms of at least 2.9 inches but observed 10 events of this size or greater.
This comparison shows that the count of extreme 24-hour rainfall events observed in Negley Run during this period is consistently greater than the median Atlas 14 projections would suggest at all frequencies.
So, while I think it’s reasonable to clearly communicate that we won’t be able to eliminate all flooding, that doesn’t mean we can’t try to estimate how often this flooding might occur under a range of possible futures. And I think getting some sense of those estimates is important for making a decision in the first place.
These are complicated problems and there’s enough uncertainty to make trying to find the perfect solution impossible. Ultimately, you want to choose not an optimal course of action but one that works reasonably well under a range of potential futures, minimizes regret, and allows for flexibility to shift goals and priorities if reality turns out much differently than anticipated. To make this choice, the analysis should be up-front about sources of uncertainty and present potential solutions in a way that clearly articulates the tradeoffs people truly care about. I hope members of the common council ask lots of good questions.